
Attention, lumen! Peak values for photometric data
Many people know it from sound engineering when the power specifications of the loudspeakers or amplifiers promise a powerful device and you ends up hearing a transistor radio during the listening test. This trend has also found its way into lighting technology. The following examples show how “peak values” can be achieved.
Google it
Let’s start with a simple example: We have measured the illuminance with our luxmeter and know the beam angle of the spotlight and the distance from the spotlight to the luxmeter. Today you don’t open a book, everything is on the internet. Now we google for a “lux to lumen calculator” and of course we find several.
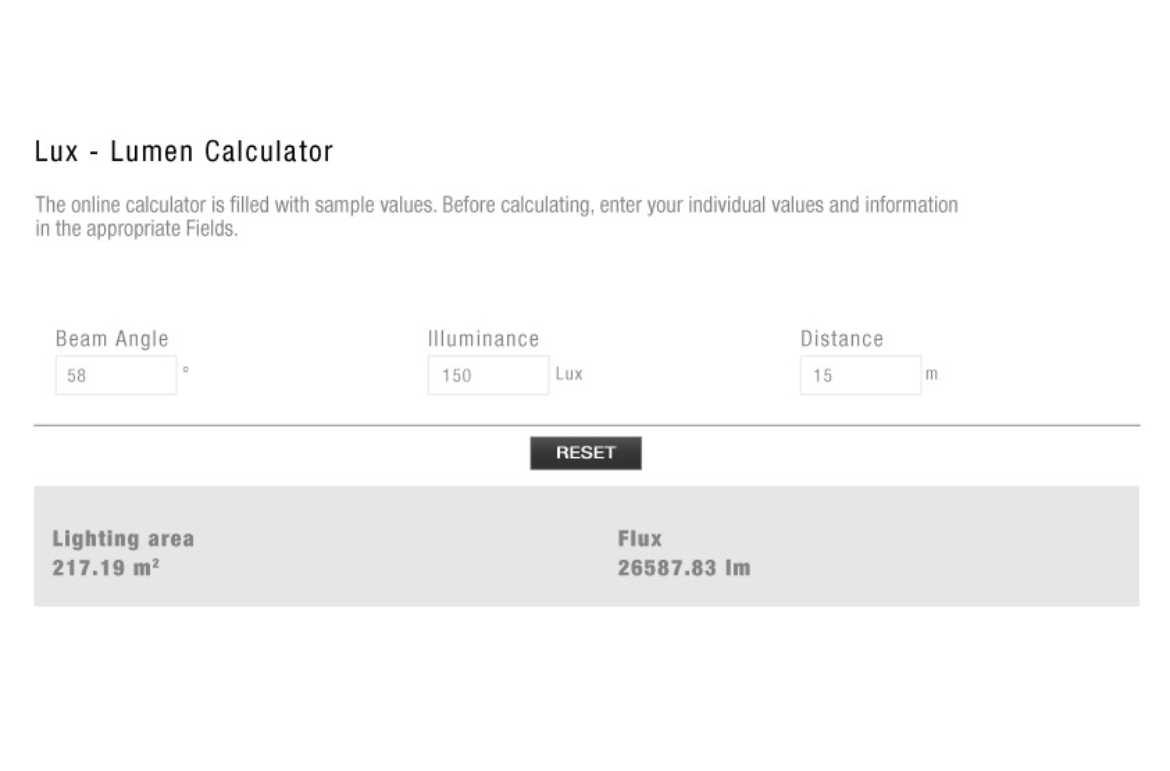
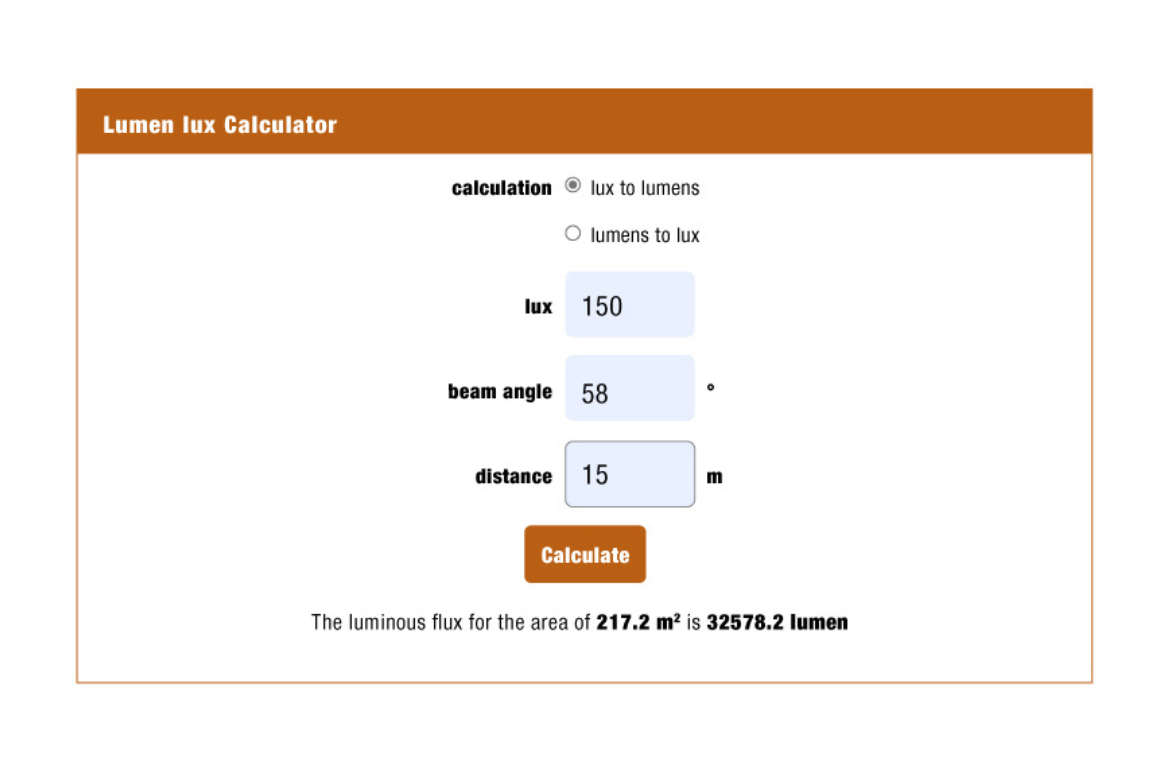
No sooner said than done, we enter the data on the first hit page, e.g. 150 lx at a distance of 15m with a beam angle of 58°. On the website, a luminous flux of 26587 lm is calculated Great – so simple. But now let’s make a comparison and call up another website with a “lux to lumen calculator”. This website’s result comes in at 32578 lm. This is a discrepancy of 5991 lm from website to website.
And the child of insecurity is born. From whence comes such a difference?

Website a 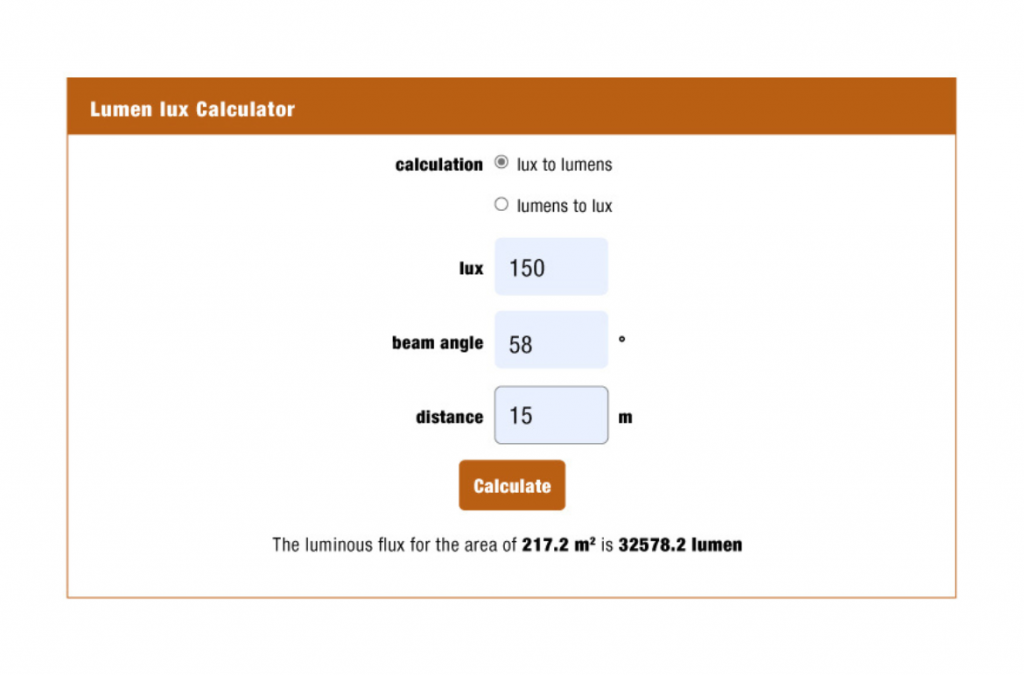
Website b
To get to the bottom of things,
Website a) uses Luminous flux Φ (lm) = I (cd) x Ω / and Ω = 2π * ( 1 – cos ( α / 2) )
Website b) uses Luminous flux Φ (lm) = E (lx) x A (m²) and A = (d² × π)/4; d/2 = r x tan (α /2)
actually, both formulas should give the same result if you use I (cd) = E (lx) x r².
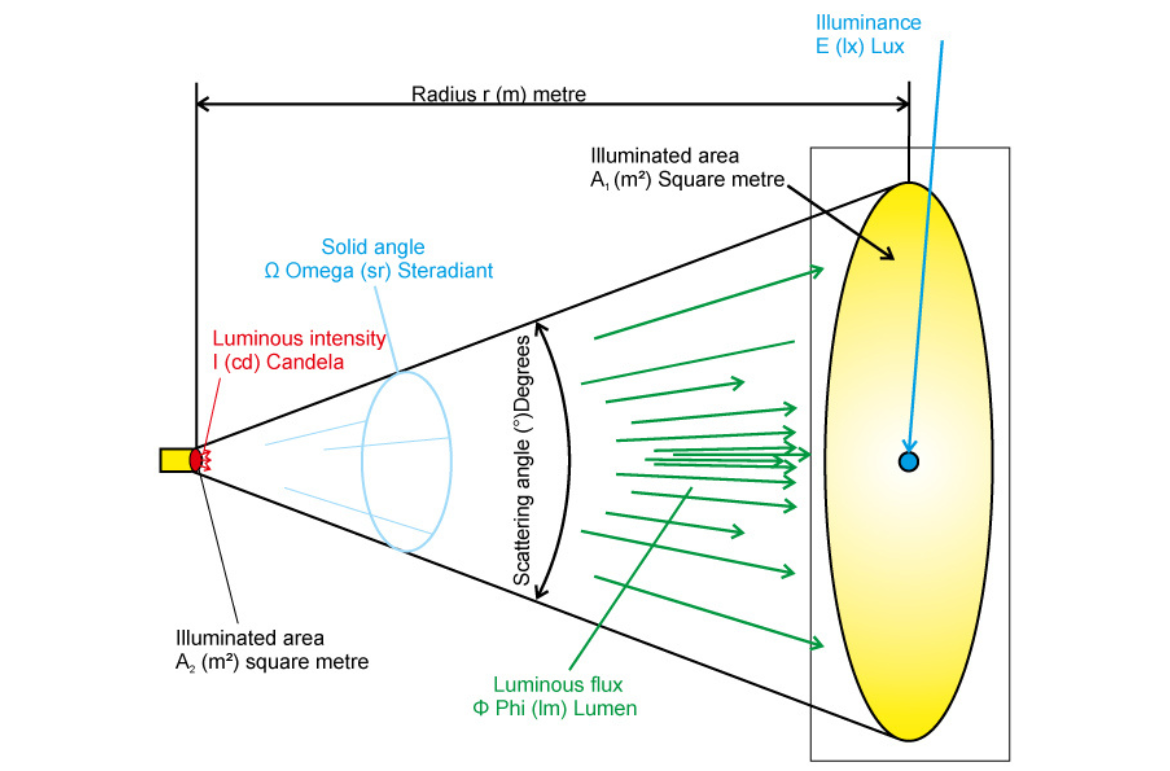
Nevertheless, different values are calculated, because in one case the calculation is made using the solid angle, which takes the illuminated area of a spherical surface of the solid angle, while in the other case the area of a plane projection is used. In the case of the plane surface, as the radiation angles increase, the area becomes larger and larger than the area of the spherical surface. In the extreme, with a 180° radiation angle, the surface of the plane becomes infinite, whereas the surface of the sphere is finite at 180°.
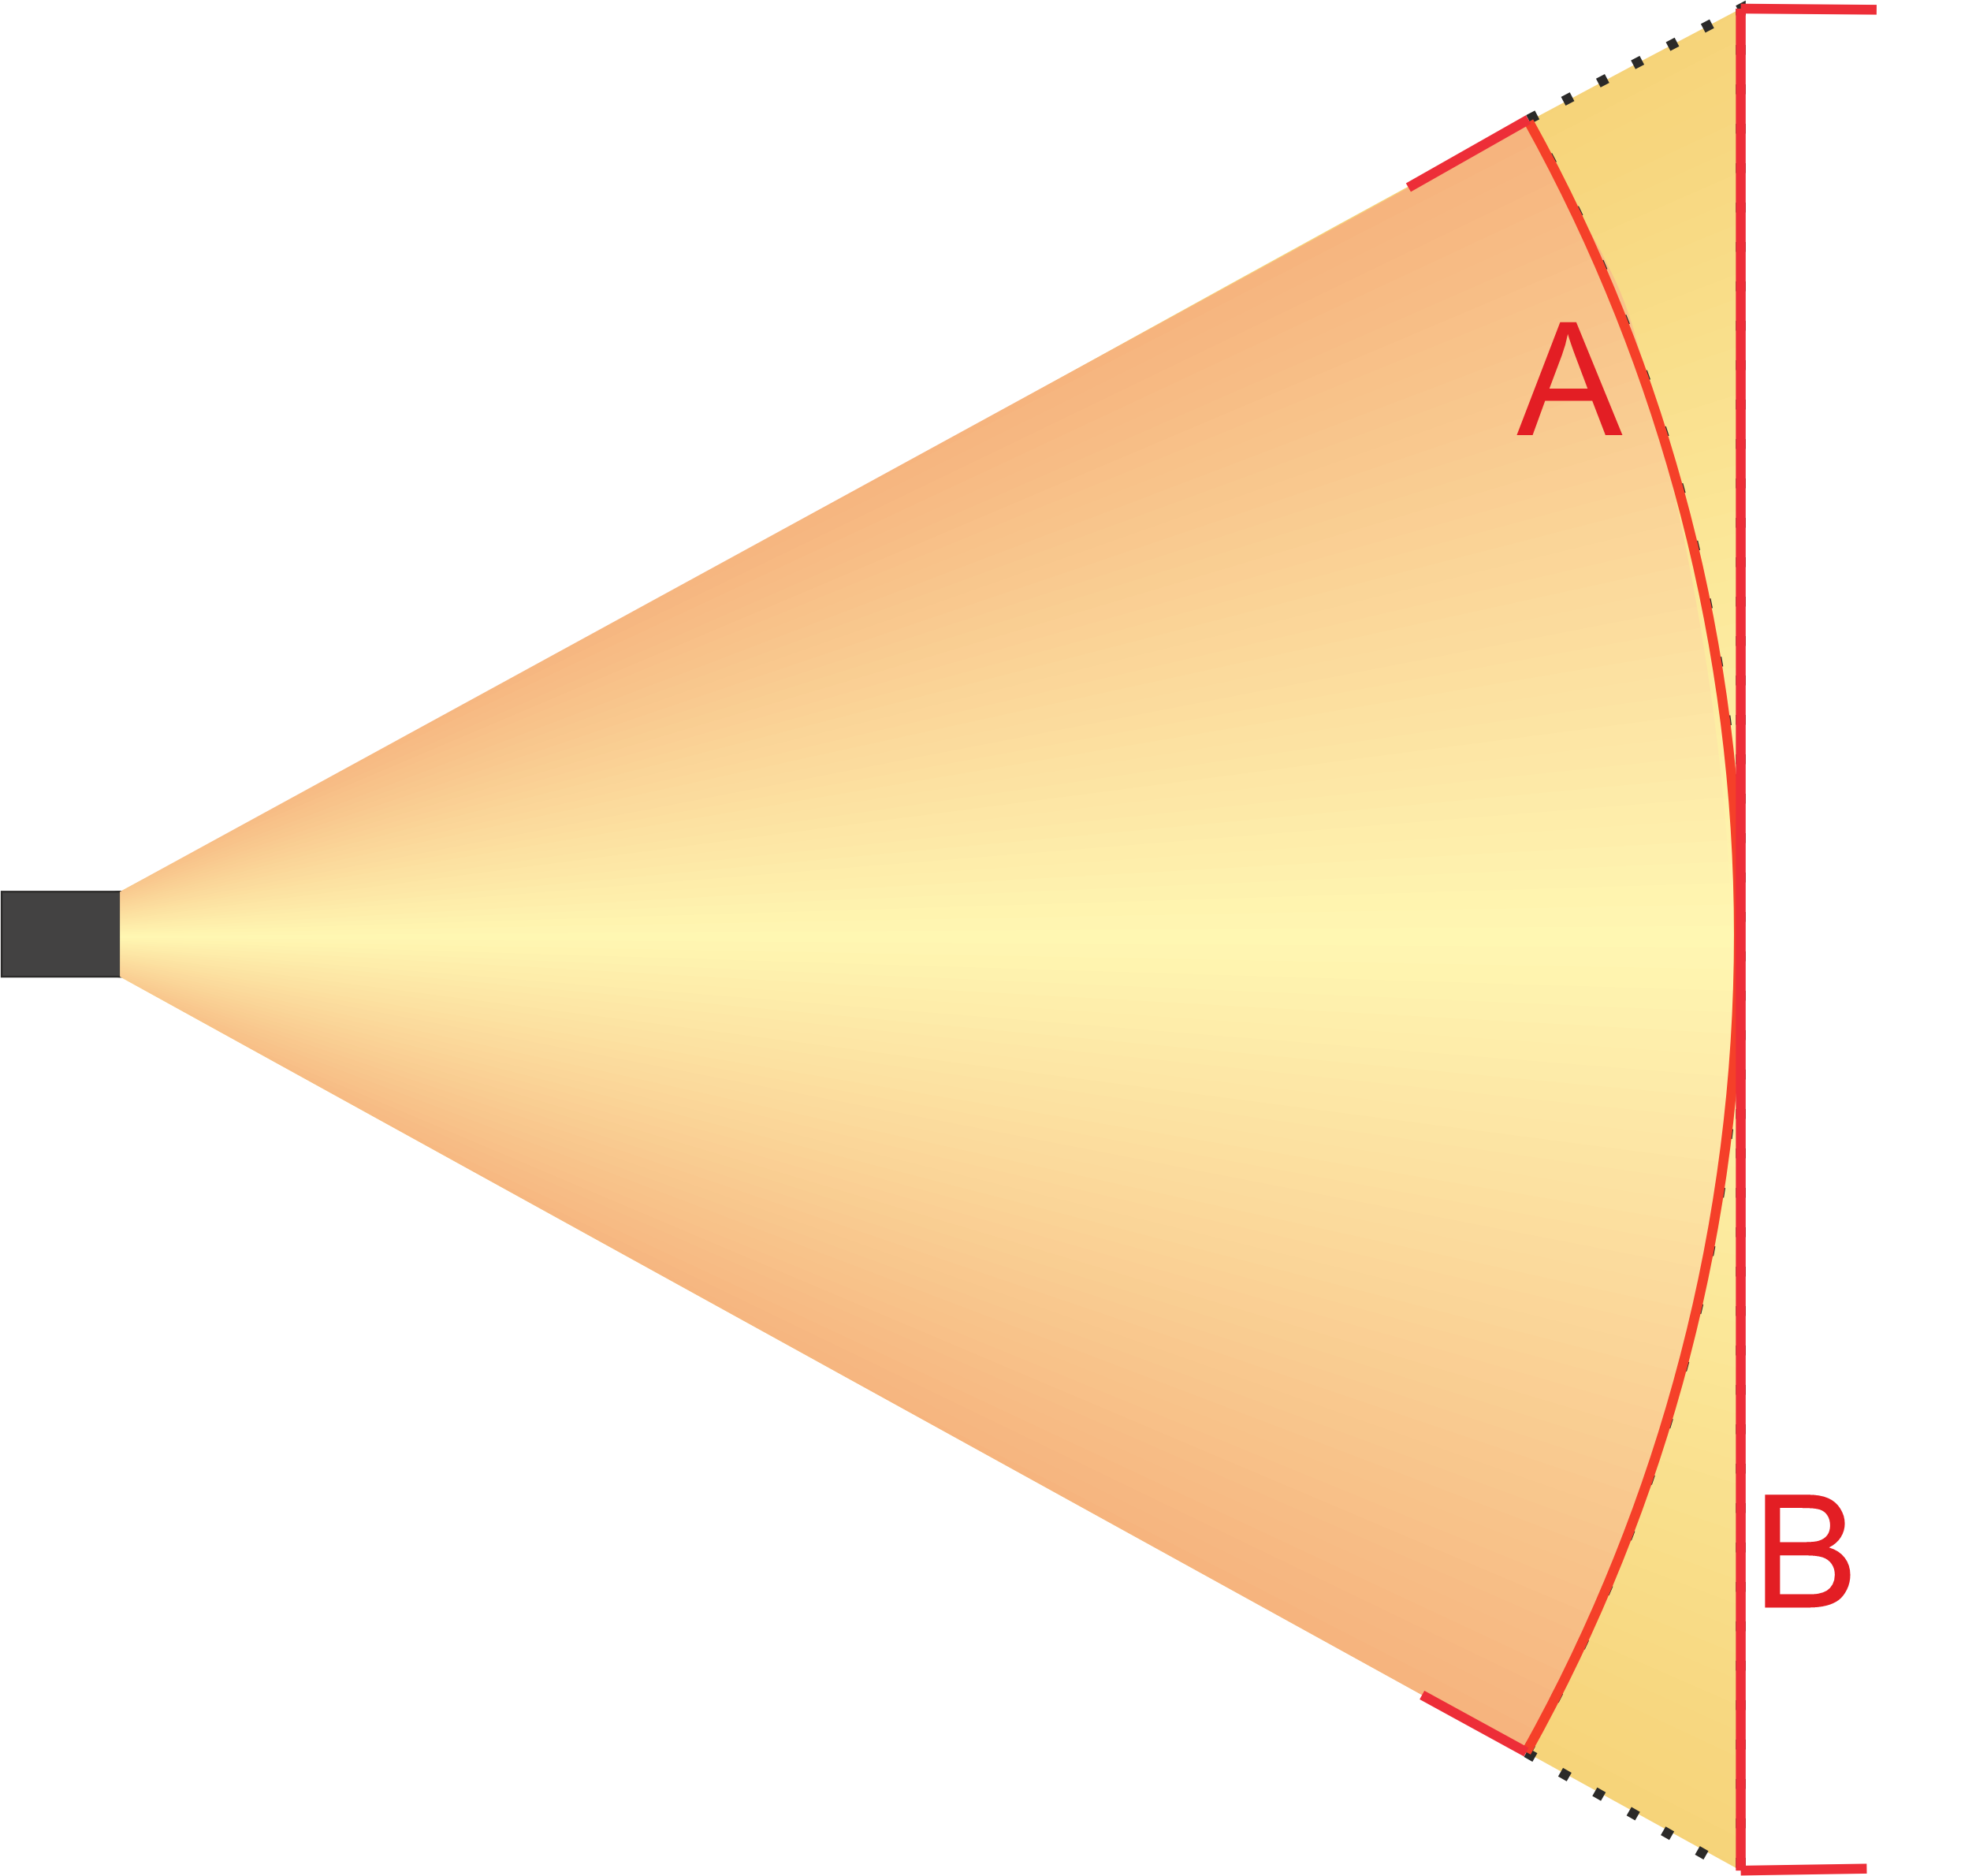
The values used in our example result in a spherical surface (A) of 177.25 m² pertaining to the solid angle. The area at level (B) is 217.188 m². If you take the other value in each case and insert them into the formulas above, the results are the same.
WWW – Simplified
Apart from the surface variants, the web pages are based on simplified formulas that completely disregard light distribution on the illuminated surface. If we speak of a beam angle without further specification, then we assume a beam angle. This means that the beam angle is defined where the luminous intensity is only 50% of the brightest luminous intensity, which is usually determined in the centre. The simplified formulas, on the other hand, assume a constant brightness over the entire surface. Consequently, the use of the convenient conversion pages from the internet serves more as a rough estimate. From this point of view, the comparison of the recorded electrical power of a headlamp offers more informative value. If you still want to use your measured illuminance values (measured in lux) to arrive at the luminous flux, then you can use numerical integration. There are formulas for this as well, see e.g.: here.
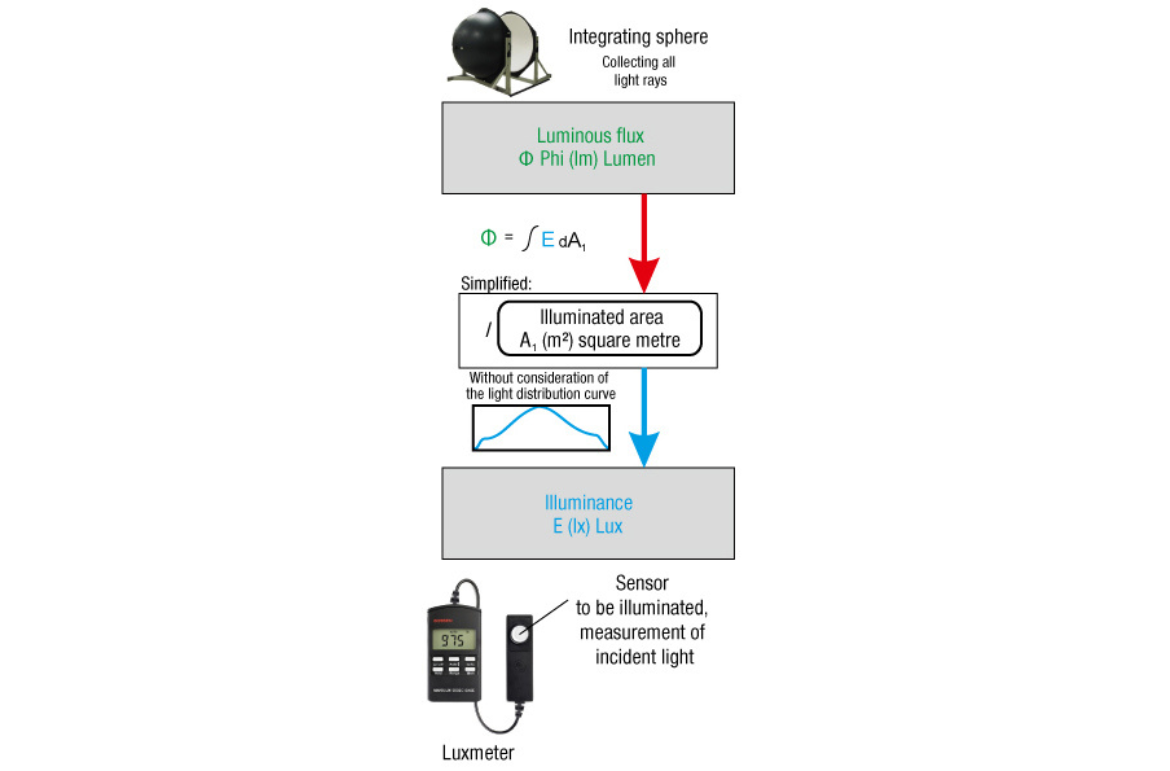
Numerical integration can be used to calculate the luminous flux of rotationally symmetrical light cones from illuminances. A simplification or simple multiplication results in higher values.
Even if you do not have an integrating sphere or photogoniometer, the luminous flux can be determined using a luxmeter and numerical integration. And is much more accurate than the simplified formulas found on the internet.
Don’t rush it
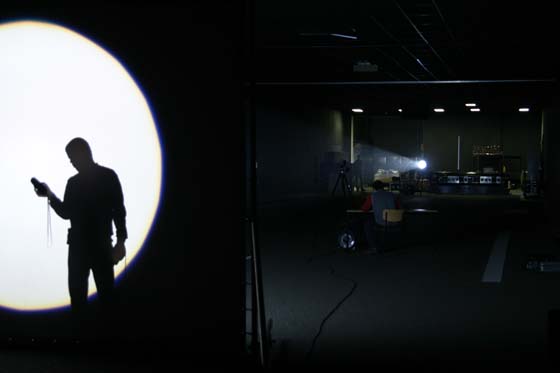
If the manufacturer hands over his spotlight to an accredited measuring institute for the compilation of his photometric data, you can be sure that the values are determined correctly there. Most spotlight manufacturers serving the event industry have acquired a photogoniometer and or integrating sphere to impress the user with the sheer number of measurement results in a wide variety of spotlight settings. What has crept into our industry with the introduction of the LED as a light source is the measurement immediately after switching on or insertion of the light beam. Time is money. Now a characteristic of the LED comes into play: the brightness decreases exponentially with increasing heating. In practice in the event industry (VA), for example, the luminous flux and illuminance are often determined immediately after switching on. The correct procedure would be to wait until the spotlight is in a steady state. However, it often takes much more than half an hour before you can press the measuring button. Some spotlights, for example, never reach a steady state, but regulate back and forth between two states, which does not indicate good temperature management.
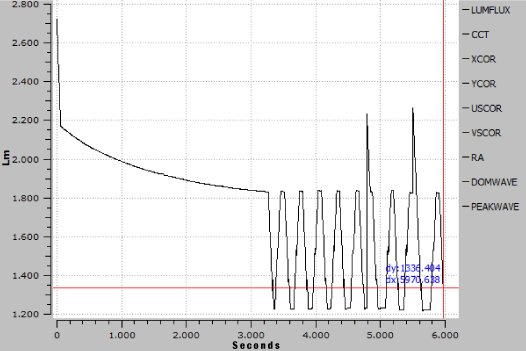
The luminous flux in this example decreases rapidly within a short time until ventilation kicks in. After more than 3000 sec., i.e. approx. 50 minutes, the fan cooling is no longer sufficient and the LED board protection circuit dims the LED. In the process, it cools down to such an extent that it can be fully controlled again shortly afterwards. This is now repeated endlessly, the luminaire never finds a constant brightness.
All present and correct
It’s almost like the Olympic Games. In the competition for the brightest light, the spotlight is optimised for measurement. Spotlights also vary in brightness due to the fluctuations of the LED chips. So it is legitimate to pick out the brightest from one’s production so that one is back in the game again in terms of the competition. Particularly undesirable is when the UV_IR filter has been forgotten in front of the lamp in the comparison sample or in the device to be measured, as has already been the case with discharge lamps, for example. Or the interchangeable modules, such as the Gobo module, are removed for measurement. This can also add a few percentage points, just like finding the brightest zoom focus setting, which again is perfectly fine. Just whether the fans work against natural convection or with it can improve or worsen the measurement result by 2.8%. For each measurement, the condition of the lamp should be described in detail.
Beam angle
We can go from very narrow to very wide, one manufacturer shone when stating its beam angles in its brochure. It was not possible to remeasure it in this way until it was clarified. The narrow beam angle was specified with the beam angle and the wide zoo setting with a 1/10 degree field angle. Aside from the fact that apples and pears were placed on the scales here, the angles can also be measured differently and the measurement result does not have to correspond to what we see with our eyes. Take, for example, a sharply drawn zoom spotlight or profile spotlight or spot moving head. If we cast the light cone vertically onto a wall, we are inclined to get out the folding rule and measure the light cone from one edge to the other. With the distance to the spotlight, it is quite easy to calculate the beam angle by means of trigonometry. But in the rarest of cases, this will probably not be the beam angle found in the photometric data. This is because if you define the term beam angle with the 50% angle or half-value angle, you have to specify the angle that is present in the light cone at 50% brightness compared to the brightest brightness. And this is usually not the marginal area of a sharply drawn profiler. As a rule, the 50% level is usually already undershot within the light circle. Now we’ll put one more on top. When we walked along the wall with the folding rule to measure the distance to the sharp edge area or the diameter, we could now follow this measuring line with a luxmeter and measure where the 100%, the following 50%, and finally the 10% brightness for the 1/10 degree angle are to be measured. It should be noted that the luxmeter must always be aligned perpendicular to the steel source, otherwise the angular error of the measuring device will have too much influence. In addition, the distance to the light source increases with the distance from the centre, which of course also has an influence, because according to the law of distance, the brightness decreases as the square of the distance. For this reason, the light distribution curves or beam angles are often determined with a turntable, so that a) the distance to the light sensor always remains the same and b) the light sensor is always positioned perpendicular to the light source. Now there is a general precondition. The photometric distance law roughly states that a minimum distance from the luminaire to the measuring sensor is required for a certain measuring accuracy, which depends on the size of the light-emitting surface of the luminaire and the expected beam angle. Up to this point, we have dealt exclusively with idealised rotationally symmetrical light cones. In other words, the simple section through the axis of the light cone. Aside from asymmetrical light cast as in the floodlights also mentioned, the influence of the base or the electrode-holding glass bodies in the light image had already been seen at that time in the discharge lamps and halogen lamps. For this reason, the Americans, very early on, proposed the use of an iso-illuminance diagram for the evaluation of the light distribution with their ANSI E1.9, which had to indicate a 3% brightness as the last line and the further gradations in steps of 10.
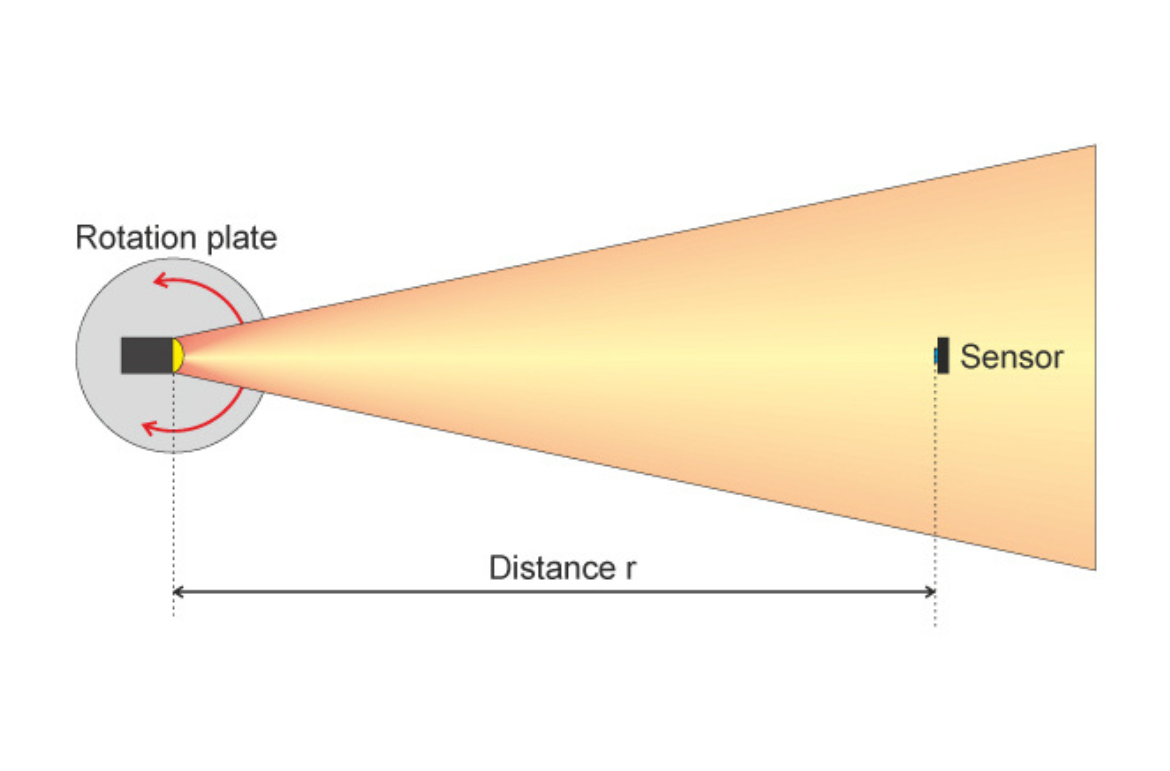
Radiation angle detection with the turntable corresponds to the spherical surface of the solid angle. In addition, the sensor is correctly aligned and the distance to the sensor is constant.
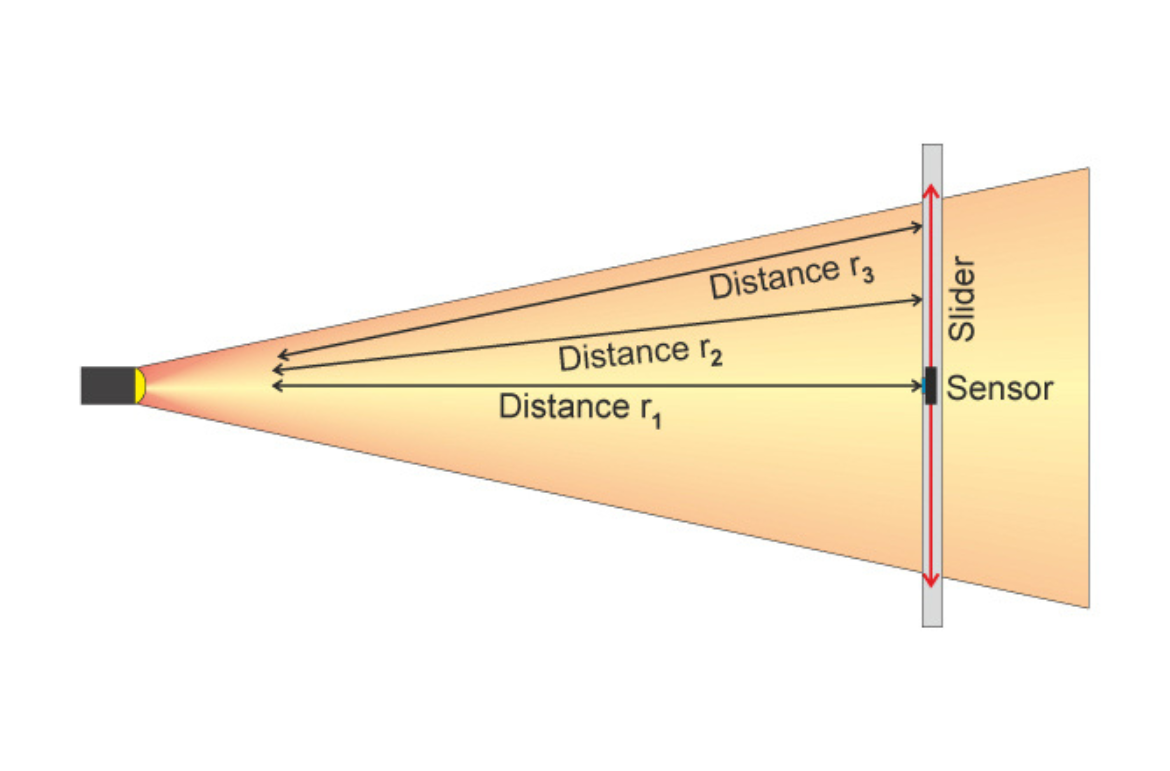
The linear detection of the beam angle, on the other hand, corresponds to the practical projection behaviour, just as the spotlight will also cast the light onto the stage. However, the sensor would always have to be aligned to the light source and the changed distance compensated for. This method is not practical for wide-beam luminaires such as a softlight.
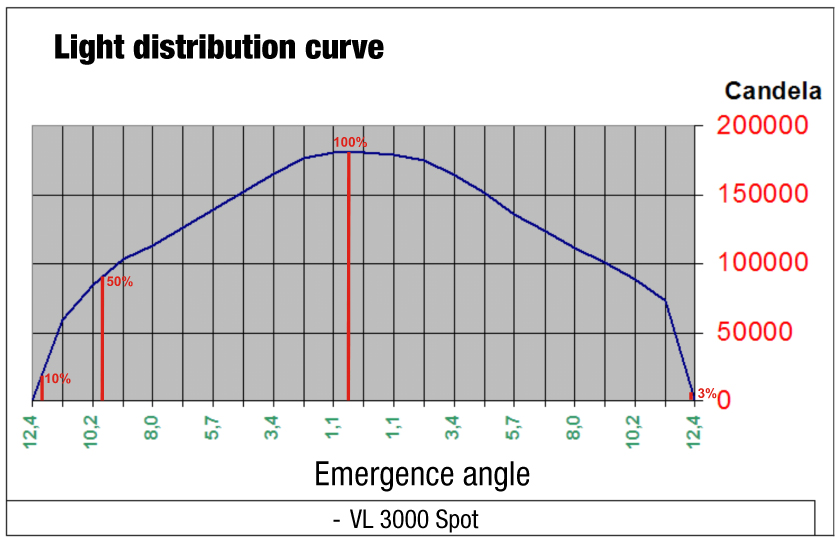
The light distribution curve of this sharply drawn profile spotlight clearly shows that the 50% or half-value angle does not correspond to the sharply drawn edge area that our eye prefers as a limit.
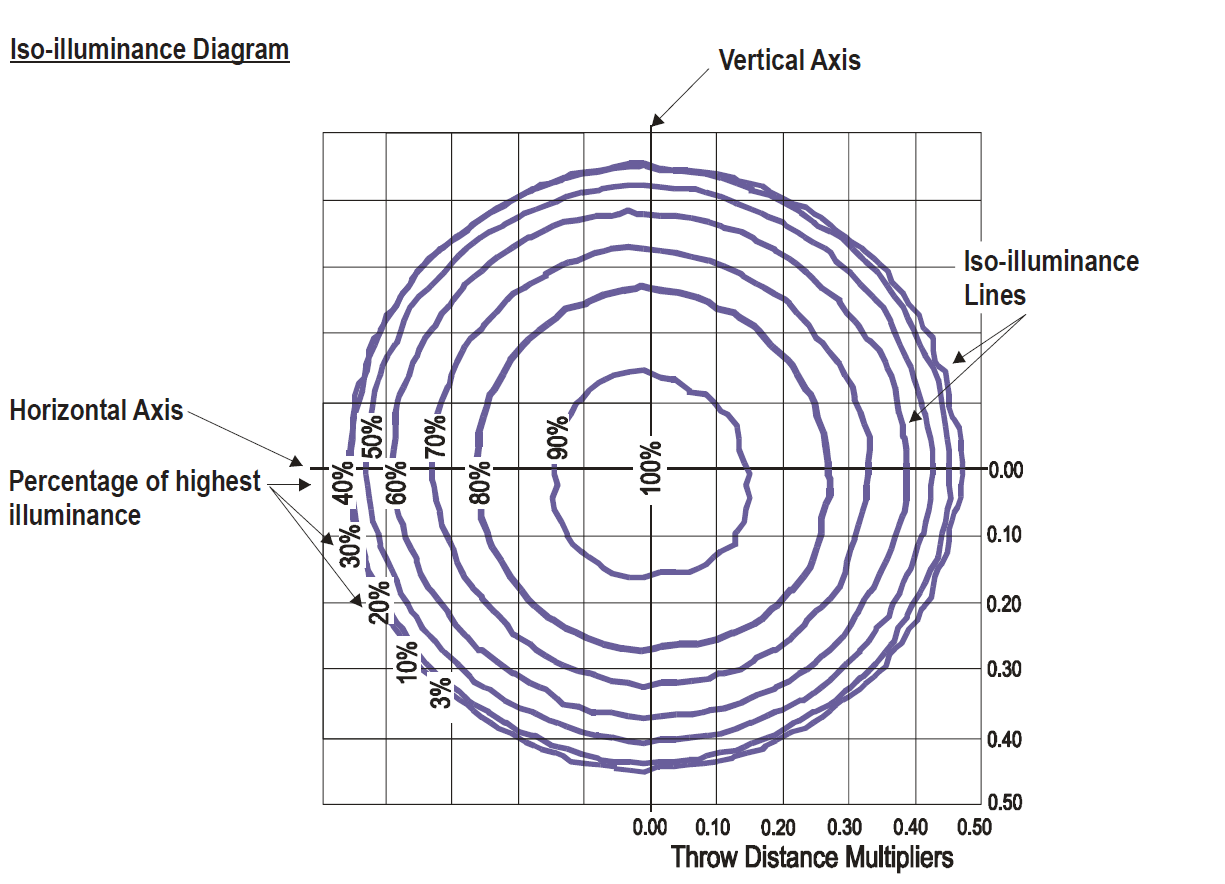
Light distribution isograph diagram proposed according to ESTA E1.9. In contrast to the light distribution curve, influences of bases or non-rotationally symmetrical light patterns are also visible here, but it is only suitable for medium to narrow-beam floodlights.
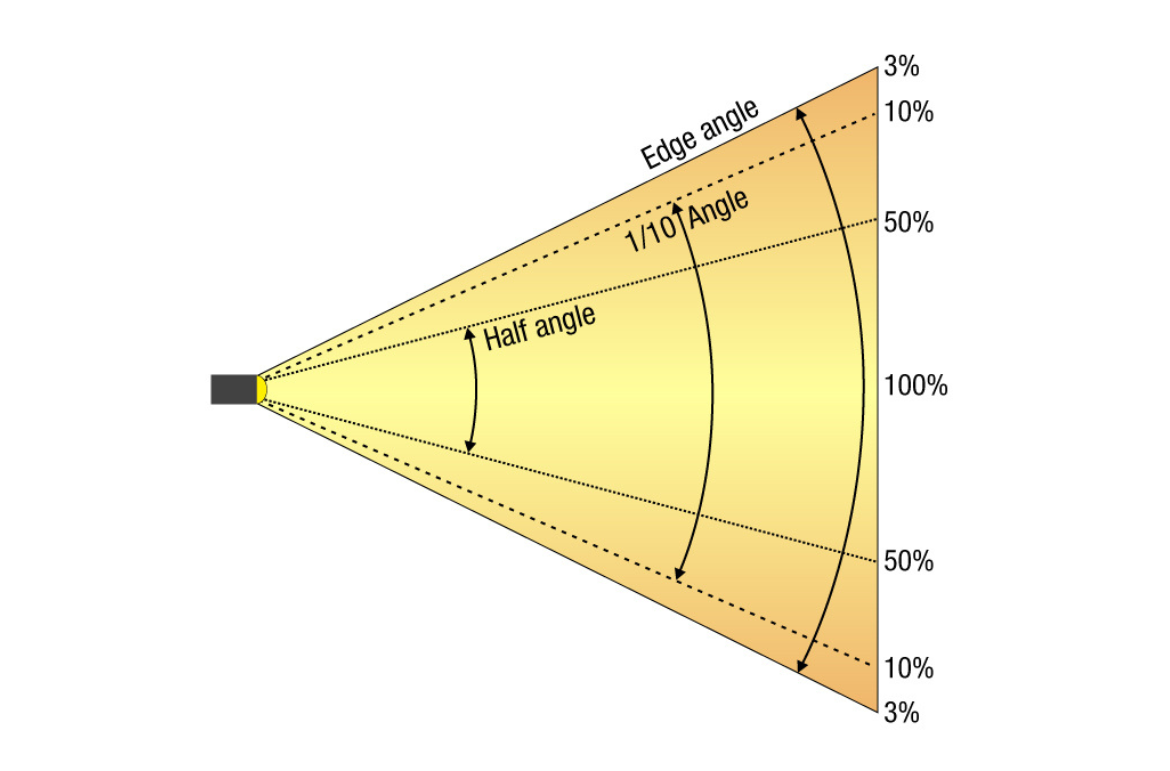
Definition of the beam angle:
Beam angle = 50% angle;
1/10 field angle = 10% angle;
Cutoff angle = 3% angle.
Luxmeter or integrating sphere
Many lighting companies and event venues already have a luxmeter in use. With the advent of the LED, these meters were mostly updated to also counter the measurement error caused mainly by the blue peak of the white light LED and the visible spectrum filter. See also here. From time to time, a spectrometer is also used. And again, different measurement results are displayed on the handheld spectrometer that has just been calibrated than can be read in the photometric data of the luminaire. There is no ill will here, but with the handheld unit you measure e.g. the chromaticity coordinate (x y or u’ v’) or the closest colour temperature in Kelvin (CCT) only at one point in a circle of light. Unfortunately, for comparative measurements, the position of the measurement in the light cone would have to be determined precisely in order to obtain reproducible values. Here, in the worst case, a shift of a few cm is sufficient for other values. If you go to the fringe area, which is already visually distinct from the centre, it becomes even clearer. For this reason, colour locations or colour temperatures are often measured using an integrating sphere so that all ranges are included and comparability with other luminaires is achieved. Thus, although the wonderful colour temperature of 3200K is present in the centre of the light cone, the data sheet only talks of 3078 K because the reddish edge area in the integrating sphere also contributes to the result of the averaging.
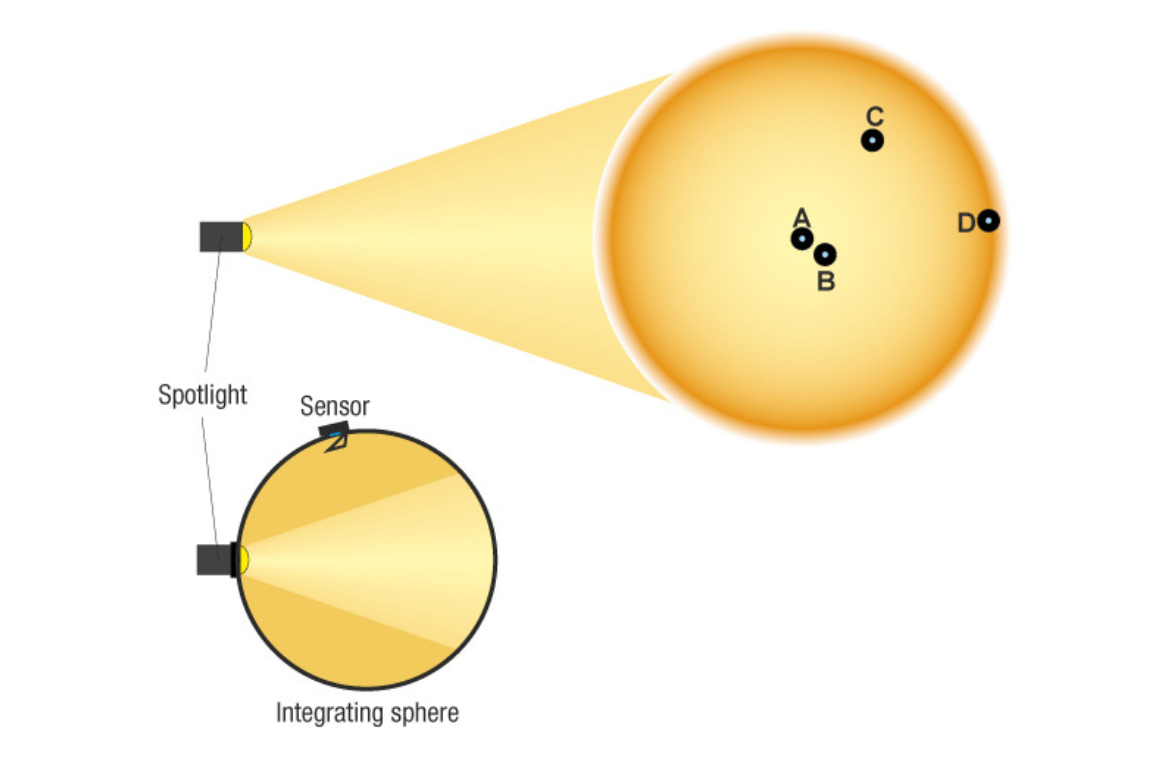
Depending on where you position your handheld measuring device in the light cone (A-D), you will get different measurement results. Therefore, for comparative measurement, the measurement with the integrating sphere is more suitable because it equalises positioning errors as it takes all light rays into account. For this, you also get values, such as a colour temperature or colour location, that do not correspond to the one measured, for example, in the centre of the spotlight as it is used in practice.
Rock n Roll vs. Architecture
But to be clear, lighting technology and photometric data are basically reliable data with which one can calculate and plan. The measurement methods are laid down in DIN standards, have been tried and tested for decades and provide a reliable basis for planning. At least that’s how it is in architecture. In the field of architecture, the lighting of buildings, streets, hotels, etc. is completely planned and simulated long before the first bid for a spotlight is submitted.
It’s quite different in the events industry. Here, lighting moods are usually developed organically during lighting rehearsals, with the material chosen from the wealth of experience.
You know what to expect from a 1.2kW headlamp. With LED bulbs, the wattage of the bulb no longer matches the experience. Here, the indication of the luminous flux Φ in lumen (lm) becomes the first point of reference to describe the brightness of the spotlight. However, as long as there is no uniform measurement in the event industry, one can only recommend that the spotlights in question be subjected to a direct comparison.
With the possible deviations in photometric data in the event industry, it is still advisable to subject the spotlights to a direct comparison to see for yourself how the much higher stated luminous flux also shows up in the light image.
#Cameo #ForLumenBeings #EventTech #ExperienceEventTechnology
Further information:
cameolight.com
adamhall.com
This might also interest you
Party meets precision – Ca ...
17. July 2025
Light in the old gas tank � ...
15. July 2025
Honouring the past, driving ...
8. July 2025
Recent Post


Popular Posts


UK Show Space – Now Open! A Recap of the Opening
January 31, 2024